- 易迪拓培训,专注于微波、射频、天线设计工程师的培养
LabVIEW MathScript开发算法:第二部分——MathScript 交互式窗口
目录
- MathScript 含义
- LabVIEW MathScript 窗口
- 使用MathScript 窗口进行算法开发
- 相关链接
1. MathScript 含义
无论您是要开发算法、研究信号处理概念还是分析结果,利用LabVIEW
参见:
LabVIEW MahtScript示例库:本站点包含了大量LabVIEW MathScript示例。
至页首
2. LabVIEW MathScript 窗口
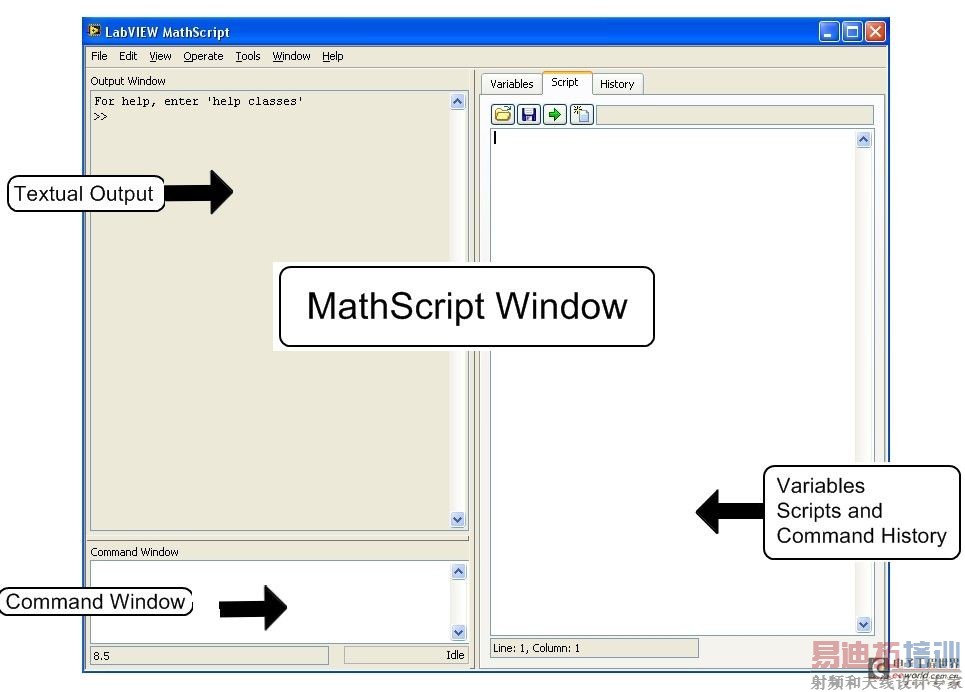
您可以利用两种接口来使用LabVIEW MathScript——LabVIEW MathScript
您可以使用交互式MathScript

至页首
3. 使用MathScript 窗口进行算法开发
- 在Getting Started窗口中,选择Tools»MathScript Window来激活MathScript
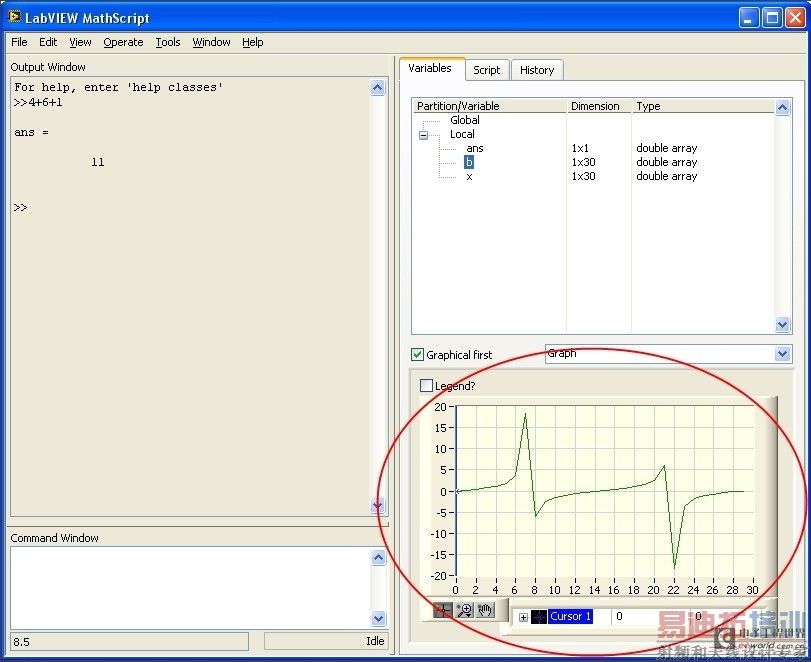
窗口。 - 在Command Window文本框中输入4+6+1并按键。命令的结果将在Output Window中显示。您可以一次性输入命令来及时计算出结果。
- 点击Variables标签。LabVIEW
会更新变量、ans,在位于Partition/Variable树形条的Local下方,可以看到上次命令的执行结果。 - 点击Script标签来输入下列命令
x=linspace(0,2*pi, 30);
b=sin(x)./(cos(x));
plot (x,b);axis([0 2*pi -20 20]);
注意x = linspace(0, 2*pi, 30);命令生成一个新的x变量并在0到2*pi内均匀取30个值来填入变量。 - 在Script页面上点击Run按钮,将出现Plot 1窗口并显示x相对于b的XY曲线。您可以通过点击Plot 1窗口的右上角的x来关闭窗口。

- 点击Variables标签来显示您所建立的变量,如x和b
- 在Partition/Variable树形条中选择b,将出现一个代表数值的表。选中Graphical First
复选框,您将首先看到变量值的图形显示,而不是缺省的数值显示。 [p]

- 点击Script标签并点击
Load按钮。选择Mitra P2_1.m(Mitra, Sanjit and Kaiser, James H., 数字信号处理手册Handbook for Digital Signal Processing [New York: John Wiley and Sons, 1993], 21)。该脚本生成一个测试信号并在该信号上应用滑动平均滤波器。 - 点击Run按钮来运行该脚本,将出现Prompt User for Input对话框。在Desired length of the filter=文本框中输入正值并点击OK按钮。MathScript
脚本可以包含交互式对话框来提示用户输入。 - 下方显示的Mitra P2_1.m脚本,通过子绘图命令,指定绘图窗口(Plot window)内4幅子图(sub-plot)中的一幅。用户指定子图(sub-plot)后,后续命令随即影响该子图(sub-plot)。例如,当子绘图命令结束后,绘图命令可将其本身指定的绘图装入先前由子绘图命令指定的子图(sub-plot)。
% Program P2_1
% Simulation of an M-point Moving Average Filter
% Generate the input signal
n = 0:100;
s1 = cos(2*pi*0.05*n); % A low-frequency sinusoid
s2 = cos(2*pi*0.47*n); % A high frequency sinusoid
x = s1+s2;
% Implementation of the moving average filter
M = input(Desired length of the filter = );
num = ones(1,M);
y = filter(num,1,x)/M;
% Display the input and output signals
clf;
subplot(2,2,1);
plot(n, s1);
axis([0, 100, -2, 2]);
xlabel(Time index n); ylabel(Amplitude);
title(Signal #1);
subplot(2,2,2);
plot(n, s2);
axis([0, 100, -2, 2]);
xlabel(Time index n); ylabel(Amplitude);
title(Signal #2);
subplot(2,2,3);
plot(n, x);
axis([0, 100, -2, 2]);
xlabel(Time index n); ylabel(Amplitude);
title(Input Signal);
subplot(2,2,4);
plot(n, y);
axis([0, 100, -2, 2]);
xlabel(Time index n); ylabel(Amplitude);
title(Output Signal);
axis;
您可以使用Command Window文本框来找出更多命令信息。利用在Command Window
上一篇:labview使用中内存的问题
下一篇:LabVIEW中测试测量数据的存储(6)


