- 易迪拓培训,专注于微波、射频、天线设计工程师的培养
Help regarding HSMS 2855 Schottky diode output voltage Vs input RF power levels plot in ADS
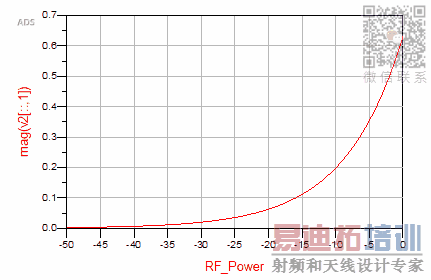
I have simulated HSMS 2855 agilent diode in ADS but the plot of output voltage vs the input RF power level simulated in ADS is not like that of the datasheet. Attached is the document containing the schematic, the simulation plot and the desired plot.
Please help me out.
附图/附件
In general, there could exist many reasons that ADS simulation results could diverge from a manufacturer's datasheet:
* Source of the vendor data: are the plots from measured data or simulated data? If measured data, what was the measurement technique? How much uncertainty due to possible measurement error? If simulated data, what simulator was used? If it was ADS, is the setup identical to your setup?
* Uncertainty in the model; nonlinear modeling by its very nature is not an exact science
Thank you for your reply.
I converted the y axis scale to log scale and got the correct results.
Hi, i did the simulation withsame setup as shown in the "plot_datasheet.docx" . I got the same simulation result, while it still didn't comply with the data in the sheet.


申明:网友回复良莠不齐,仅供参考。如需专业帮助,请学习易迪拓培训专家讲授的ADS视频培训课程。
上一篇:Reg: Power Amplifier combining
下一篇:ADS layout component ID size
 国内最全面、最专业的Agilent ADS培训课程,可以帮助您从零开始,全面系统学习ADS设计应用【More..】
- Agilent ADS教学培训课程套装
- 两周学会ADS2011、ADS2013视频教程
- ADS2012、ADS2013射频电路设计详解
- ADS高低阻抗线微带滤波器设计培训教程
- ADS混频器仿真分析实例视频培训课程
- ADS Momentum电磁仿真设计视频课程
- ADS射频电路与通信系统设计高级培训
- ADS Layout和电磁仿真设计培训视频
- ADS Workspace and Simulators Training Course
- ADS Circuit Simulation Training Course
- ADS Layout and EM Simulation Training Course
- Agilent ADS 内部原版培训教材合集
