- 易迪拓培训,专注于微波、射频、天线设计工程师的培养
How to import ADS data to MATLAB
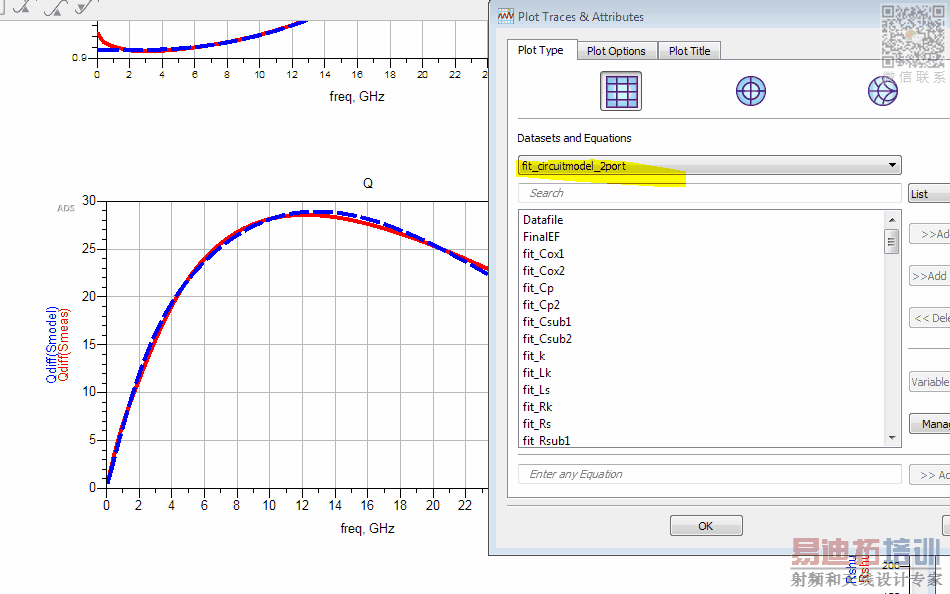
What do you miss? You can plot multiple curves in ADS into one graph, just select the corresponding dataset in the dropdown list.
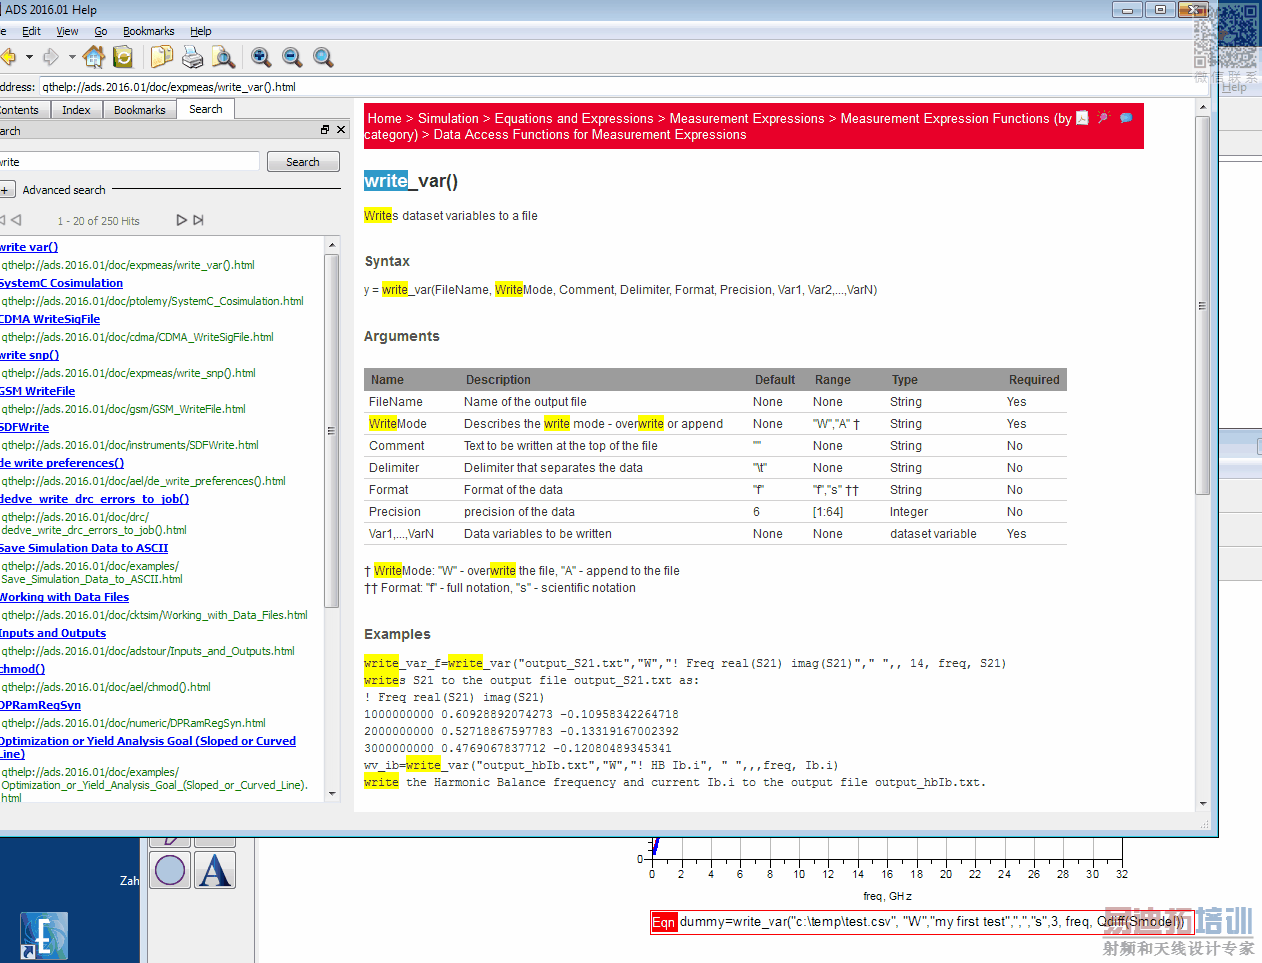
If you still prefer Matlab, have at look at write_var() in the ADS online help. That is a function to write data from the ADS data display to a file. It is used by placing an equation on the data display page: dummy = write_var ()
I think you miss read my question. I have designed the filter for different substrates, like FR4, Roger Duroid 5880, ect, and i want to combine these results in one graph, like one graph for insertion loss for all the substrate materials
Where to add write_var() in ADS, i couldn't find any place type a command in ADS?
I understood your question, and that is easily possible. I do it all the time! You can place as many different datasets into one graph as you like. You can switch datasets as I showed above, and add S-params from different datasets using that dialog.
You add this as an equation in the data display, as shown in my second screenshot at the very bottom. The variable on the left side of the equation is just a dummy, the relevant part is calling the write_var function with the correct parameters.
It worked!, I have not noticed that before. Thank you for your help :) :)
申明:网友回复良莠不齐,仅供参考。如需专业帮助,请学习易迪拓培训专家讲授的ADS视频培训课程。
上一篇:caculate Zin of a HF rectifier using ADS
下一篇:Errors in ADS2011_10,While placing Components from Modelithics Library
 国内最全面、最专业的Agilent ADS培训课程,可以帮助您从零开始,全面系统学习ADS设计应用【More..】
- Agilent ADS教学培训课程套装
- 两周学会ADS2011、ADS2013视频教程
- ADS2012、ADS2013射频电路设计详解
- ADS高低阻抗线微带滤波器设计培训教程
- ADS混频器仿真分析实例视频培训课程
- ADS Momentum电磁仿真设计视频课程
- ADS射频电路与通信系统设计高级培训
- ADS Layout和电磁仿真设计培训视频
- ADS Workspace and Simulators Training Course
- ADS Circuit Simulation Training Course
- ADS Layout and EM Simulation Training Course
- Agilent ADS 内部原版培训教材合集


