- 易迪拓培训,专注于微波、射频、天线设计工程师的培养
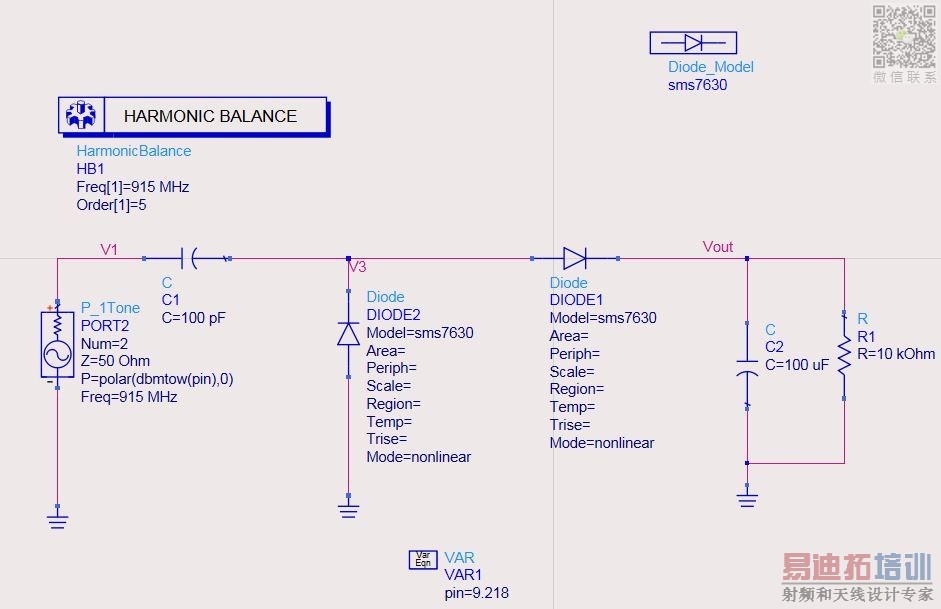
Measure impedance of rectifier using harmonic balance in ADS software
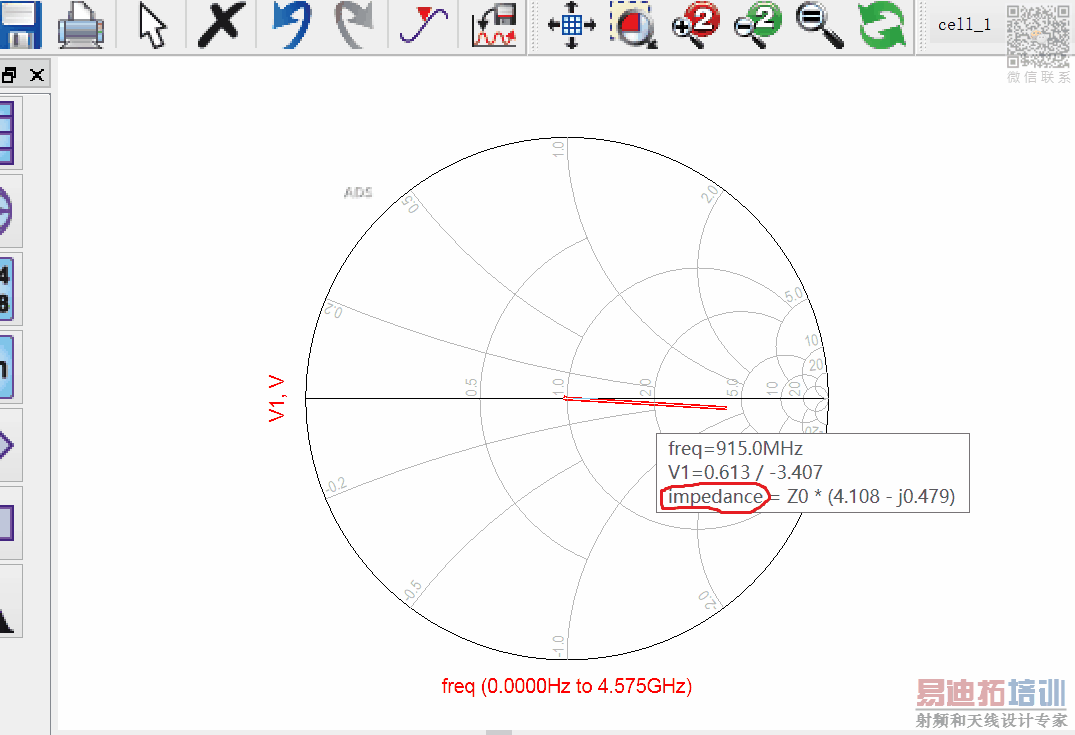
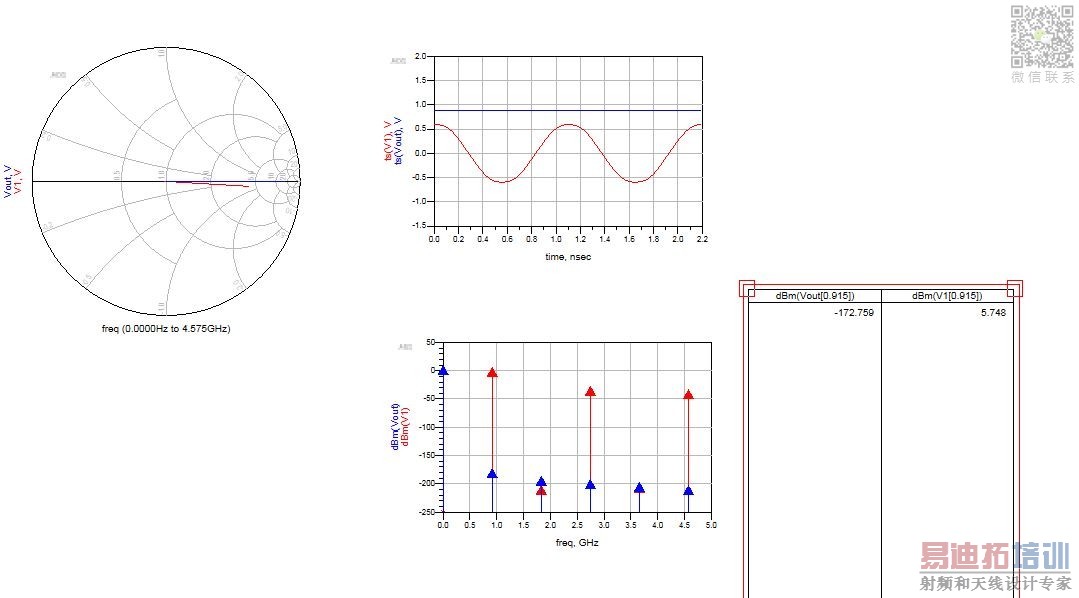
As the pictures show, the frequency is 915MHz and power is 0dbm. I had got some result after simulation. Z0=50ohm, impedance of V1=Z0(4.108-j0.479), impedance of Vout=Z0(1-j7.163E-10).
But I am confused which point of impedance should be used to do impedance matching, V1 or Vout?
What do you mean by V1 and Vout ?
They are complex voltages not impedances.
Edited by Dora: arrogant phrasing removed.
Large Signal/Nonlinear Impedances are not simulated as you did..
Use I.Probe component and Define Impedance being as :
Z=V<complex quantity>@freq/I.Probe.i <complex quantity>@freq=<complex quantity>@freq
Thanks. I know the definition of the impedance. V1 and Vout are just name of the two points instead of voltage. They are not voltage. Maybe I should say "Z0=50ohm, impedance of point V1 is Z0(4.108-j0.479), impedance of point Vout is Z0(1-j7.163E-10).
LOL. Why it shows the impedance on the smith chart of point V1 and Vout directly? It's not the impedance of point V1 and Vout?
I don't think that you know what the Impedance is..
The value which you saw on the Smith Chart is a Complex Quantity of the Voltages, not Impedances..Smith Chart does not show Impedances only, it's an Abaqus and it show any Complex Normalized Quantity whatever is..
You have a long road to run..
Sorry, I'm a beginner. But it does show "impedance", as this picture show . It's not impedance?

Locus is a reflection coefficient not impedance in Smith Chart.
Edited by Dora: arrogant phrasing removed.
You mean the word "impedance " in the picture refers to locus? It's not really impedance? My understanding is the the load impedance should equal to the complex conjugate of the source impedance in order to get maximum power transfer. If Zsource=50+20j, we should using matching network(capacitors and inductors) make Zload=50-20j.
In dc circuit impedance=resistance while in AC circuit impedacne=resistance+reactance
Maybe I can ignore the rectifier and just consider the load?
Smith Chart is a plot of reflection coefficient not impedance.
Zin=Vin[1]/Iin[1] ; Input Impedance for fundamental
Sin=(Zin-Z0)/(Zin+Z0), Z0=50
Plot Sin not Iin.
Edited by Dora: arrogant phrasing removed.
Ok. I can understand the reflection coefficient. The smith chart does not show impedance. The point is that I thought that the software calculate the impedance and show it automaticlly. As the picture shows, it's "impedance=Z0*(4.108-J0.479)". Can you see the picture?
You are completely misunderstanding.
Your V1 and Vout are not impedance.
If you plot Reflection Coefficient, marker of Smith Chart show impedance.
Edited by Dora: arrogant phrasing removed.
申明:网友回复良莠不齐,仅供参考。如需专业帮助,请学习易迪拓培训专家讲授的ADS视频培训课程。
上一篇:ADS Impedance Matching Design with Tool
下一篇:ofdm simulation of PA for ads
 国内最全面、最专业的Agilent ADS培训课程,可以帮助您从零开始,全面系统学习ADS设计应用【More..】
- Agilent ADS教学培训课程套装
- 两周学会ADS2011、ADS2013视频教程
- ADS2012、ADS2013射频电路设计详解
- ADS高低阻抗线微带滤波器设计培训教程
- ADS混频器仿真分析实例视频培训课程
- ADS Momentum电磁仿真设计视频课程
- ADS射频电路与通信系统设计高级培训
- ADS Layout和电磁仿真设计培训视频
- ADS Workspace and Simulators Training Course
- ADS Circuit Simulation Training Course
- ADS Layout and EM Simulation Training Course
- Agilent ADS 内部原版培训教材合集


