- 易迪拓培训,专注于微波、射频、天线设计工程师的培养
CST2013: List of Result Plots
Navigation Tree: 2D/ 3D Results  <Result Plot>
  Result Plot List
It is possible to overlay multiple 2D and 3D near field plots of a fixed phase to one plot:
Activate the option Navigation Tree: 2D/ 3D Results
 <Result Plot>
  Overlay Multiple Plots.
Generate your first plot; for instance, an arrow plot of an electric field
Click "store" in this (List of Result Plots) dialog box. You will then be asked to give your plot a name.
Generate a new plot; for example, by selecting an H-field monitor from the navigation tree.
All selected plots in the list will be laid over the current plot. Try changing the color ramp for more clarity.
Store
Stores the current plot and all settings like scaling, phase, color ramp. After the plot has been stored, it cannot be modified further. It can, however, still be zoomed, rotated or panned.
Deselect all
Deselect all plots in the above list.
Delete
Deletes all selected plots in the above list.
Help
Shows this help text.
Close
Closes this dialog box without performing any further action.
Example
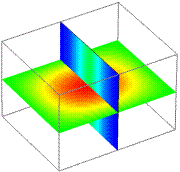
Cavity with eigenmode, E-field green-yellow-red, H-field green-cyan-blue.
Left: two overlaid arrow plots. Right: two overlaid 2D cuts.

CST微波工作室培训课程套装,专家讲解,视频教学,帮助您快速学习掌握CST设计应用
上一篇:CST2013: 2D/3D Result View
下一篇:CST2013: Frequency Domain Solver Overview - Resonant: S-Parameter, fields
 最全面、最专业的CST微波工作室视频培训课程,可以帮助您从零开始,全面系统学习CST的设计应用【More..】
频道总排行
- CST2013: Mesh Problem Handling
- CST2013: Field Source Overview
- CST2013: Discrete Port Overview
- CST2013: Sources and Boundary C
- CST2013: Multipin Port Overview
- CST2013: Farfield Overview
- CST2013: Waveguide Port
- CST2013: Frequency Domain Solver
- CST2013: Import ODB++ Files
- CST2013: Settings for Floquet B
