- 易迪拓培训,专注于微波、射频、天线设计工程师的培养
CST2013: 2D/3D Result View
This view allows the visualization of all previously defined two- or three-dimensional monitors. Depending on the result type, there are several different plot options that allow a great insight into the behavior of the fields inside of the structure.
Naming conventions of folder entries
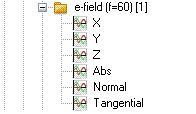
| The entries in the navigation tree denote the monitor name, the monitor type with additional settings as well as the stimulating port and its mode. The first part of the entry is the monitor name, e.g., ”e-field” as shown in the picture on the left hand side. Depending on the monitor type–time domain or frequency domain–additional settings are displayed in brackets following the monitor name. For time domain monitors, the text between the brackets starts with t (for time) and indicates the begin and end of the time interval recorded with this kind of monitor. For frequency domain monitors, the text between the brackets denotes the frequency of this monitor starting with f (for frequency). The monitor results depend on the stimulation port and its mode. Thus, one monitor can record multiple results. To distinguish between these different results, the [port (mode)] combination is written at the end of the entry in the navigation tree. Please note that the mode is only displayed if multiple modes are available for one of the ports. |
| The frequency domain solver also creates result tree items that provide access to multiple results. These are indicated by a double-folder icon, as shown to the left. For example, the solver's Save all field results option records fields at all frequency samples without the need to define a monitor. Because this can potentially lead to a large number of results, the fields at all frequencies are stored in a single result tree item for each excitation. To select a particular frequency, please use the context menu or the results menu, which bring up the select field dialog. In the field plot view, hit the up and down arrow keys to move to the next or previous frequency. |
Monitor types
All monitor types are available for time and frequency domain if you choose the transient solver to calculate the electromagnetic fields. If you use the frequency domain solver, only frequency domain monitors will produce results that can be accessed within the navigation tree. Field monitors are currently not supported by the eigenmode solver.
E-Field (vector field): The contents of all electric field monitors can be accessed from here.
H-Field (vector field): The contents of all magnetic field monitors can be accessed from here.
Surface current (vector field): As in the H-Field folder all magnetic fields are listed here. However, the magnetic fields itself will not be plotted; the surface currents on PEC surfaces will be plotted. These surface currents are calculated directly from the magnetic fields.
Power flow (vector field): The monitors in this folder contain the Poynting vector of the entire calculation domain.
Power loss density (scalar field): The contents of all Power Loss Density monitors can be accessed from here.
Current density (vector field): The contents of all Current Density monitors can be accessed from here.
Electric energy density (scalar field): The contents of all Electric Energy Density monitors can be accessed from here.
Magnetic energy density (scalar field): The contents of all Magnetic Energy Density monitors can be accessed from here.
Port Modes (2D-Vector Field): Here the mode patterns of all modes are stored. When selected, the main view shows some additional information concerning the mode.
Monitor views
Vector Fields: Every vector field is stored in its own folder. This folder contains the vector components, the vector’s absolute values and the tangential and normal parts of the vector relative to the surfaces of the structure.
| The Normal part of the vector field is the scalar product of the surface’s normal vector and the field vector on the surface. The Tangential part is the absolute value of the difference between the vector and the normal part of the vector. All entries of a vector field folder are scalar values and may be plotted as any other scalar value. |
If a folder of a vector field is selected, the entire vector field will be plotted.
Scalar Fields: By default, scalar fields are plotted in a Contour plot on the structure’s surfaces.
2D Results: A 2D Plot may be shown either if for a 2D monitor is selected or if the plot option 3D Fields On 2D Plane from the context menu of a 3D monitor has been chosen. In the latter case you will be able to set the cutplane orientation and position in the 2D Vector Plot or 2D Scalar Plot dialog box, respectively.
3D Results: If the right mouse button of a 3D result monitor is clicked, a context menu will appear that allows to change the plot properties or to switch to a 2D-Field view. Depending on the result type, different plot property dialog boxes will be reached: either the Scalar Plot dialog box or the Vector Plot dialog box.
CST微波工作室培训课程套装,专家讲解,视频教学,帮助您快速学习掌握CST设计应用
上一篇:CST2013: Integral Equation Solver Overview
下一篇:CST2013: List of Result Plots
 最全面、最专业的CST微波工作室视频培训课程,可以帮助您从零开始,全面系统学习CST的设计应用【More..】
频道总排行
- CST2013: Mesh Problem Handling
- CST2013: Field Source Overview
- CST2013: Discrete Port Overview
- CST2013: Sources and Boundary C
- CST2013: Multipin Port Overview
- CST2013: Farfield Overview
- CST2013: Waveguide Port
- CST2013: Frequency Domain Solver
- CST2013: Import ODB++ Files
- CST2013: Settings for Floquet B


