- 易迪拓培训,专注于微波、射频、天线设计工程师的培养
CST2013: Filter Analysis / Smith Chart - Phase Rotation
Home: Macros Macros
 Filter Analysis
 Smith Chart - Phase Rotation
The macro performs a simple graphical rotation of the Smith-Chart data curve. (Note, that this is not a deembedding operation) As user input only the rotation angle is required, a negative angle rotates the curve counter clockwise. Additional markers automatically indicate crossing points at (+/-j1) and (+/-1.), respectively. The macro is useful if e.g. the focal point of the flat phase regime for a band pass needs to be rotated into the short or open point of the Smith chart for a latter estimation of coupling bandwidths (calibration).
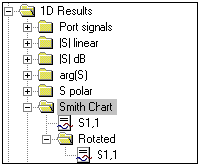
The rotated smith chart is stored in an extra folder and might be used for comparison reasons to the un-rotated Smith Chart:

Example:
a) Original Smith-chart data prior to the rotation:

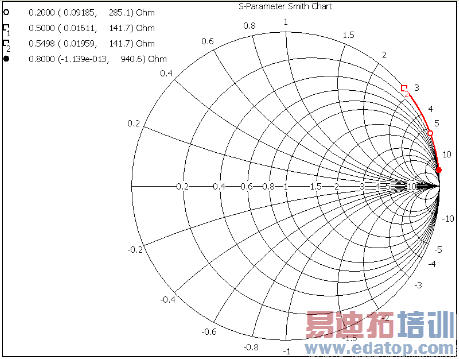
b) Smith Chart data after the rotation. The markers 1 and 2 are rotated onto (-1/j0):

As additional output crossing points at (+/-j1) can be displayed by deactivating the ”Skip Markers at +/- 90 deg” option. The markers indicate the coupling bandwidth of a bandpass filter for the first resonator.
c) Example of coupling bandwidth estimation by checking the markers Nr.1 and 3:

For the computation of the coupling bandwidth for additional resonators the zero crossings are of interest and are alternately positioned at (+/-1.,j0). From the displayed markers the coupling bandwidth can be computed.
d) Zero crossing markers are displayed, imaginary markers are ignored:

CST微波工作室培训课程套装,专家讲解,视频教学,帮助您快速学习掌握CST设计应用
上一篇:CST2013: Preloaded Macros Overview
下一篇:CST2013: Extrude Curve to Face
 最全面、最专业的CST微波工作室视频培训课程,可以帮助您从零开始,全面系统学习CST的设计应用【More..】
频道总排行
- CST2013: Mesh Problem Handling
- CST2013: Field Source Overview
- CST2013: Discrete Port Overview
- CST2013: Sources and Boundary C
- CST2013: Multipin Port Overview
- CST2013: Farfield Overview
- CST2013: Waveguide Port
- CST2013: Frequency Domain Solver
- CST2013: Import ODB++ Files
- CST2013: Settings for Floquet B
