- 易迪拓培训,专注于微波、射频、天线设计工程师的培养
CST2013: 1D / Evaluate Field along arbitrary Coordinates (1D Plot)
Post Processing: Result Templates Template Based Post Processing
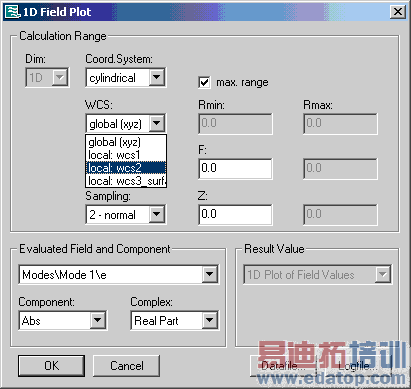
This template offers the possibility to plot a chosen field along a coordinate, which can be specified either in cartesian, cylindrical or spherical coordinate system. Additionally the template can be used to export ASCII data of a field along a curve. A prior definition of a curve with an entry in the navigation tree is not necessary.

Dim:
This option is not accessible in 1D Results Mode.
Coord. System:
With this setting the coordinate system in which the 1D curve is defined can be chosen. Possible options are cartesian, cylindrical and spherical.
WCS:
The specified curves are expressed in coordinates of a working coordinate system which is per default the global coordinate system. A local coordinate system can be selected after storing the working coordinate system (navigation tree -> right mouse button -> store current wcs).

Direction:
The direction indicates the parameter of variation. The list of options depend on the chosen coordinate system. In the example of a spherical system we can vary either the radius ”R” or the angles ”Theta” and ”Phi”. If the option ”max. range” is checked, the varying parameter will take values of the maximal range which is possible according to the description of the chosen coordinate system. If it is unchecked, this range can be chosen as well. The lower and upper limit of the variation are indicated by the ending min and max. Depending on the coordinate system and the varying parameter the two remaining coordinates are set to a fixed value for defining a 1D curve. These values can be specified in ”Calculation Range” box as well.
In the given example the 1D curve is defined by a fixed radius ”R”=5, a fixed angle ”Phi”=45 degrees and a varying parameter ”Theta”. Here, ”Theta” is varied along the maximal range.
Sampling:
This setting controls the sampling of the 1D-curve.
Evaluate Field and Component:
Here the field, which is evaluated along the curve defined in the ”Calculation Range” box, has to be chosen. Possible options are eigenmodes and 3D fields. To obtain 3D-fields 3D-monitors have to be defined before starting the simulation (solve -> field monitors).
Component:
This setting defines the field component to be evaluated. Possible options are the absolute value ”Abs”, the component of the field tangential to the specified curve ”Tangential”, X,Y and Z component. Additionally, the components belonging to the chosen coordinate system can be selected.
In the given example of a spherical coordinate system the components ”Abs”, ”Tangential”, ”R”, ”Theta”, ”Phi”, ”X”, ”Y” and ”Z” are possible options.
Complex:
Since there are some fields stored as complex field vectors the interesting part of the complex field has to be defined, that is either the real part, the imaginary part, amplitude or phase of the complex field.
Result Value:
This option is not accessible in 1D Results Mode.
DrawPoints:
(only possible after Evaluation). This option visualizes all sampling points of the chosen field and allows checking of the defined curve.
Datafile:
(only possible after Evaluation). Shows the 2 column data file with the evaluated field values along the varied parameter. Since the data is stored in ASCII format, this file can be used for exporting the field along the specified curve. The listed voxelsize is the size of the length-element, which would be used for integration.
Logfile:
(only possible after Evaluation). Summarizes informations about the performed procedure and all settings defined in the dialog.
OK
This button completes the setup of the template. The new entry will be added to the list of templates which are executed automatically after each run. The default name of the template is set according to the settings, as long the name has not been changed manually.
Cancel
Aborts the setup of the template and closes this dialog box without performing any further action.
Help
Shows this help text.
CST微波工作室培训课程套装,专家讲解,视频教学,帮助您快速学习掌握CST设计应用
上一篇:CST2013: Farfield / Grasp feed file Export
下一篇:CST2013: Farfield / Slant Polarization
 最全面、最专业的CST微波工作室视频培训课程,可以帮助您从零开始,全面系统学习CST的设计应用【More..】
频道总排行
- CST2013: Mesh Problem Handling
- CST2013: Field Source Overview
- CST2013: Discrete Port Overview
- CST2013: Sources and Boundary C
- CST2013: Multipin Port Overview
- CST2013: Farfield Overview
- CST2013: Waveguide Port
- CST2013: Frequency Domain Solver
- CST2013: Import ODB++ Files
- CST2013: Settings for Floquet B
