- 易迪拓培训,专注于微波、射频、天线设计工程师的培养
CST2013: 3D Scalar Plot
 2D/3D Plot: Properties
3D scalar plots display components or absolute values of 3-dimensional fields. You may also display 2D cuts through 3D fields by choosing the option 2D/3D Plot: 3D fields on 2D plane or the corresponding item from the context menu.
Plot type frame
Contour: All visible surfaces of your structure will be colored depending on the selected field component value. In case of normal / tangential component selected in the navigation tree, the color will be the field component normal / tangential to the surface it is plotted on.
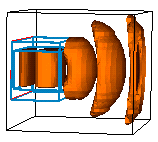
Isosurfaces: Results in surfaces on which the selected component or absolute value have a specific value. This value can be varied using the slider in the Scaling frame.
See the Color Ramp dialog box to modify the color mapping and the Specials... dialog box for the option Draw contour lines.
Note: This option is only available for hexahedral meshes.
Bubbles: Use this to visualize the scalar field values in the volume. The selected field component values are plotted in volume as bubbles with color and radius depending on the field component and position in the space. Please note that plot type "Bubbles" is not appropriate for normal / tangential component selection in the navigation tree.
Phase/Animation (Time/Animation) frame
Plot amplitude/maximum: For frequency monitors, plot the amplitude of the field vector / component in each point. For time monitors, plot the maximum from all time steps, in each point. If selected, movie will be disabled.
Plot average: Plot the field vector length / component averaged over all phases. If selected, movie will be disabled.
Phase / Time: Specify the phase in degrees for frequency monitors or time in your unit in case of time monitors.
Start / Stop: Click here to start / stop the animation.
Settings…: Opens a dialog box where you can specify field animation settings like step width.
Scaling frame
For a contour plot, the slider scales the plot linearly with a factor between 0 and 2. For isosurface plots, the slider defines the value for which the isosurface is drawn. Thus, it influences the size of the isosurface. For a bubble plot, it scales the size of the bubbles.
Please note: Scaling and logscale is disabled if clamp to range is active.
log: Turns on logarithmic scaling.
Strength: You can vary the characteristic curve used for logarithmic scaling. Values from 1.0e-6 to 100000 are allowed. A strength close to zero will result in a nearly linear plot.
Inside/outside frame
Note: This frame is only available with tetrahedral meshes.
Since every triangle is connected to two tetrahedrons, you can choose a surface plot of a structure to be calculated by taking into account the tetrahedrons lying either on the inside or outside surface of the structure.
Plot inside field: For calculation use the tetrahedrons bordering the structure surface on the inside.
Plot outside field: For calculation use the tetrahedrons bordering the structure surface on the outside.
Close
Closes this dialog box without performing any further action.
Apply
Applies any changes to the visualization. Only active if changes have been made.
Specials...
Opens a dialog box for special settings. There, among other things, you may change some parameters for scaling and plot quality.
Color ramp...
Opens a dialog box offering the possibility to change the coloring of the field plots.
Help
Shows this help text.
Example
3D scalar plot:
|
See also
2D/3D Plot Overview, Post Processing Overview,
3D Vector Plot, 3D Scalar Plot, 3D Fields on 2D Plane, 3D Scalar Special Settings, Color Ramp
CST微波工作室培训课程套装,专家讲解,视频教学,帮助您快速学习掌握CST设计应用
上一篇:CST2013: 2D Vector Plot Special Settings
下一篇:CST2013: Time Signal Processing / Exchange Excitation
 最全面、最专业的CST微波工作室视频培训课程,可以帮助您从零开始,全面系统学习CST的设计应用【More..】
频道总排行
- CST2013: Mesh Problem Handling
- CST2013: Field Source Overview
- CST2013: Discrete Port Overview
- CST2013: Sources and Boundary C
- CST2013: Multipin Port Overview
- CST2013: Farfield Overview
- CST2013: Waveguide Port
- CST2013: Frequency Domain Solver
- CST2013: Import ODB++ Files
- CST2013: Settings for Floquet B

