- 易迪拓培训,专注于微波、射频、天线设计工程师的培养
CST2013: Results / Measure resonances and Q-values from frequency data
Home: Macros Macros
 Results
 Measure resonances and Q-values from frequency data
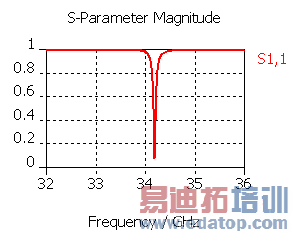
This macro helps to accurately find the resonance frequencies and their Q-values from frequency domain data such as probe amplitudes or S-Parameter amplitude.
1) select the 1D Result curve to be investigated:

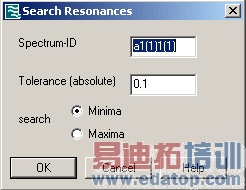
2) start macro and define the tolerance:

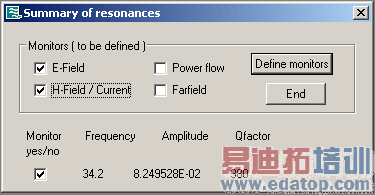
3) Found Resonances are displayed in a table together with Q-values

If desired, 3D monitors can be defined at the checked resonances.
OK
Starts the search of the resonances.
Cancel
Closes this dialog box without performing any further action.
Help
Shows this help text.
CST微波工作室培训课程套装,专家讲解,视频教学,帮助您快速学习掌握CST设计应用
上一篇:CST2013: Results / Combine 1D Results
下一篇:CST2013: Wizard / Archive Multiple Projects
 最全面、最专业的CST微波工作室视频培训课程,可以帮助您从零开始,全面系统学习CST的设计应用【More..】
频道总排行
- CST2013: Mesh Problem Handling
- CST2013: Field Source Overview
- CST2013: Discrete Port Overview
- CST2013: Sources and Boundary C
- CST2013: Multipin Port Overview
- CST2013: Farfield Overview
- CST2013: Waveguide Port
- CST2013: Frequency Domain Solver
- CST2013: Import ODB++ Files
- CST2013: Settings for Floquet B
