- 易迪拓培训,专注于微波、射频、天线设计工程师的培养
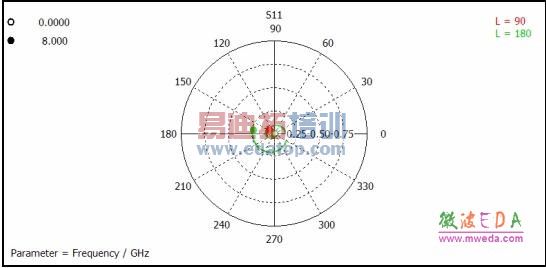
CST参数扫描分析时的史密斯圆图结果
录入:edatop.com 点击:
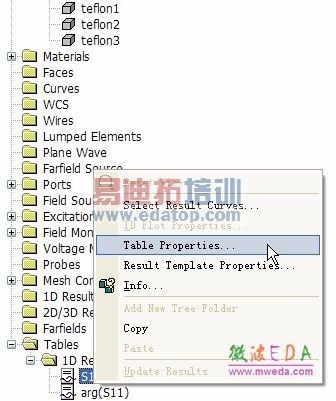
4) 右键 Table Properties 进行设置。

5) 在 Plot type 的下拉选框中选择 Polar Complex,即得到极坐标图示。


