- 易迪拓培训,专注于微波、射频、天线设计工程师的培养
CST Studio Suite Farfield Result information interpreting
录入:edatop.com 点击:
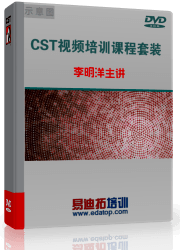
I'm running simulations for an antenna patch, and i'm trying to understand the farfield 3d information that shows from green to red with numerical values assigned to this a side bar showing green to red. I remember that the more red the numerical value, the more round the corner of a square antenna patch physically has, but that's the extent of my memory. Could there be more drawn from what i'm seeing?
This patch "delta a" as in the corners of the antenna patch rounded out significantly. "delta a" = 15
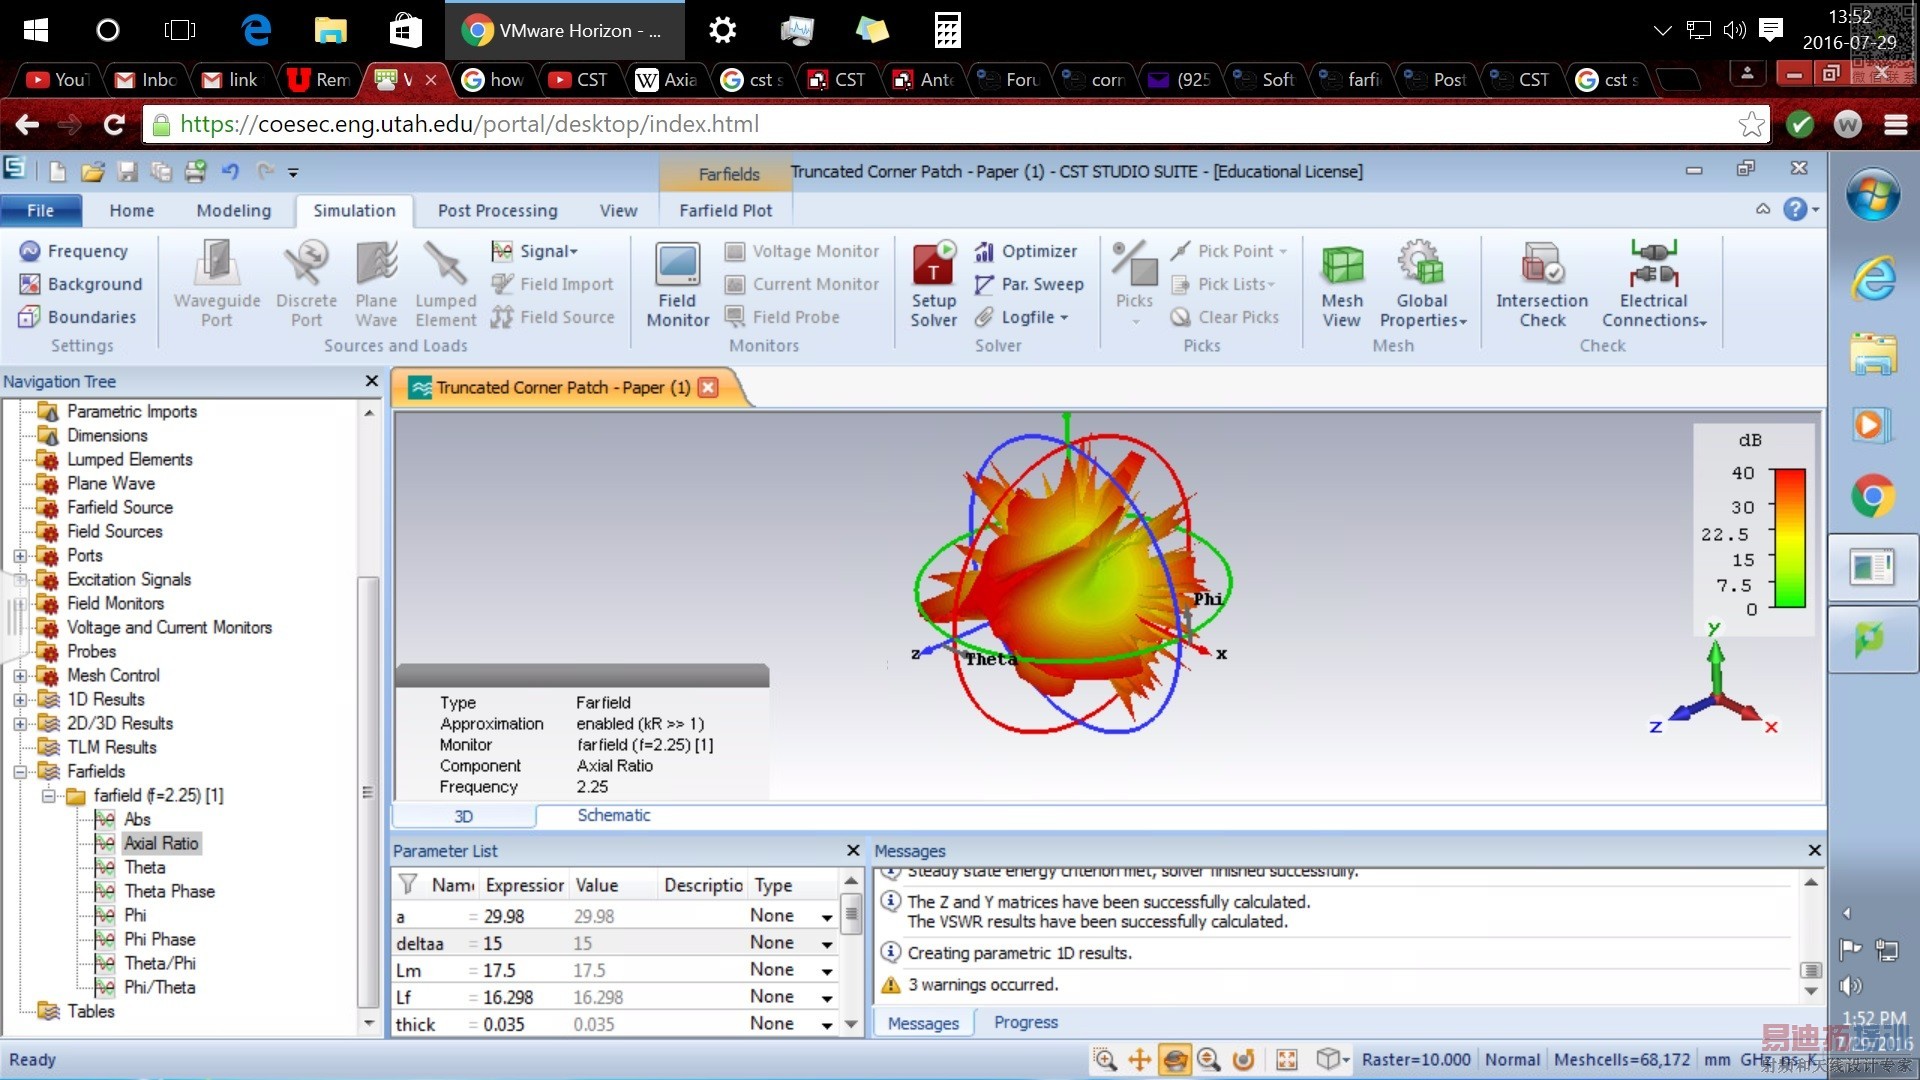
This patch "delta a" as in the corners of the antenna patch rounded out significantly. "delta a" = 5
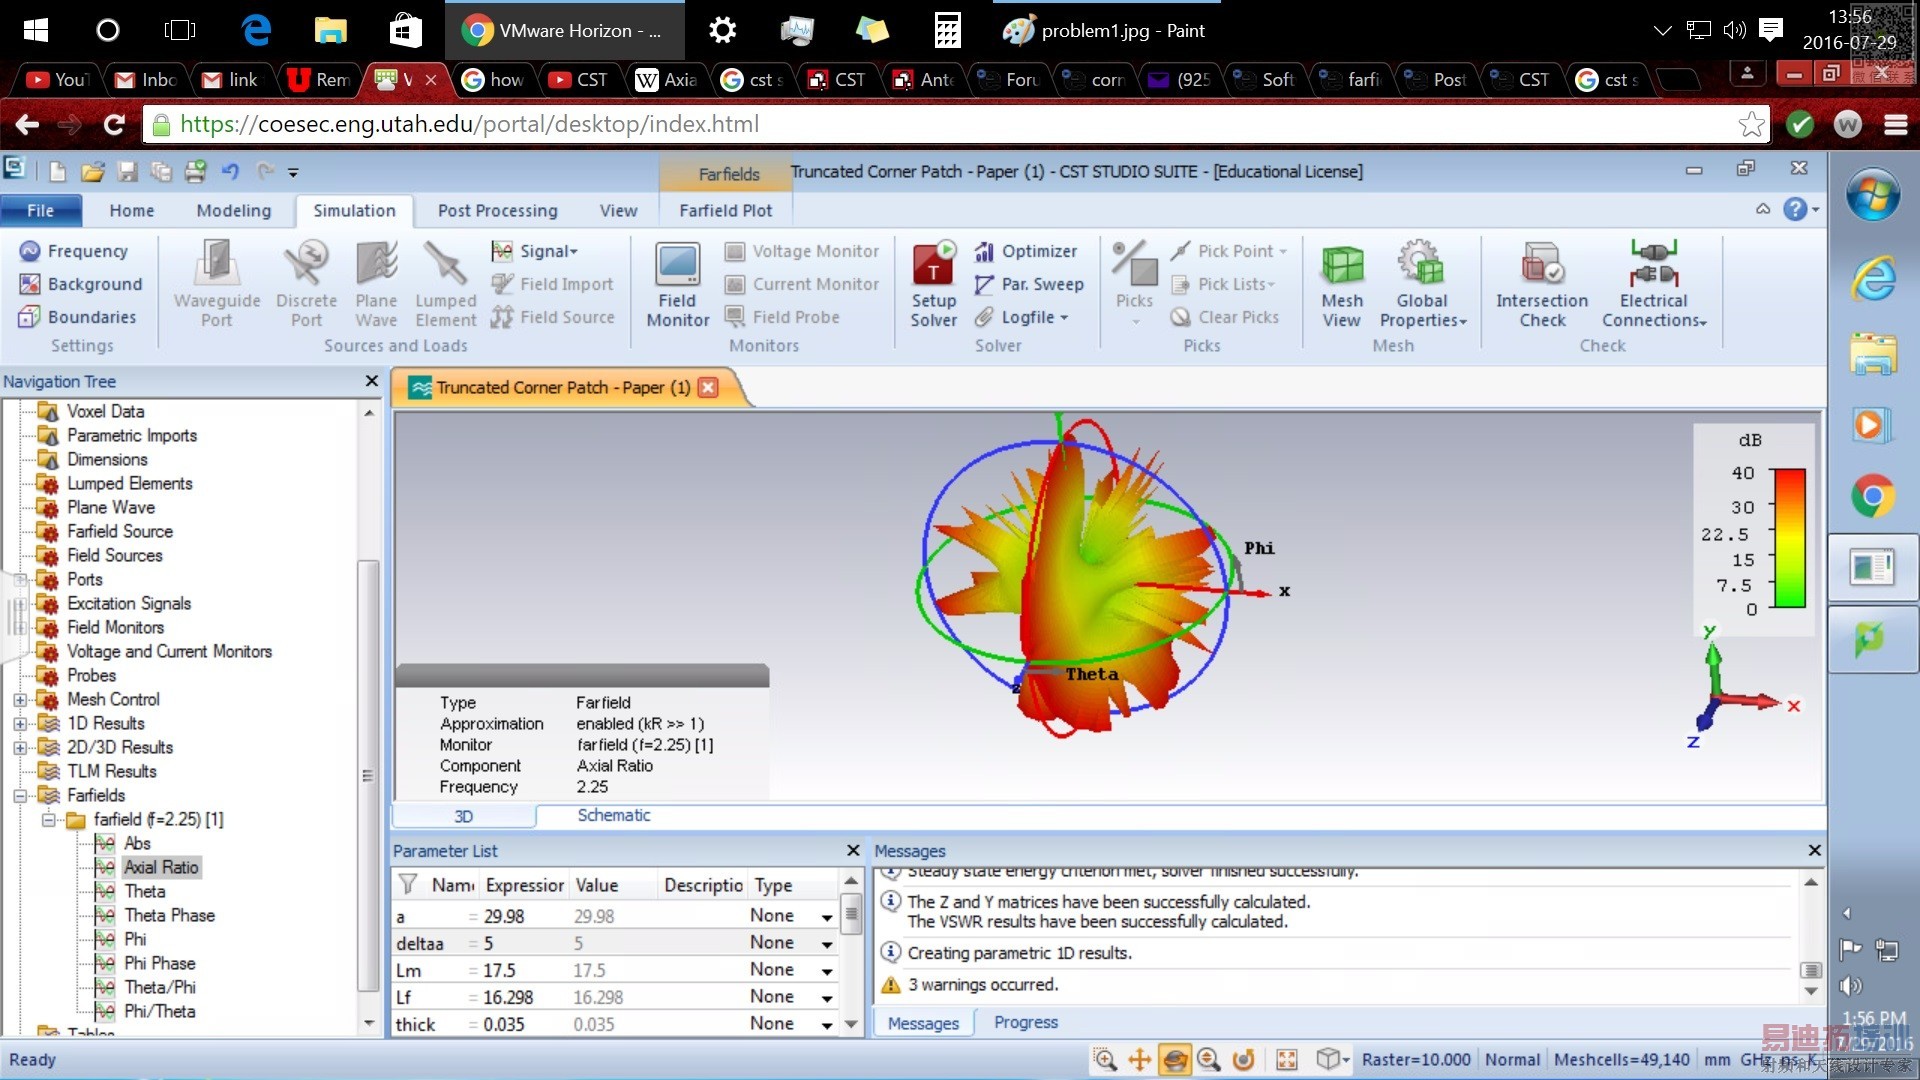
This patch "delta a" as in the corners of the antenna patch rounded out significantly. "delta a" = 0
Also, could each of the farfield graphing option be simply be explained to me please?
This patch "delta a" as in the corners of the antenna patch rounded out significantly. "delta a" = 15
This patch "delta a" as in the corners of the antenna patch rounded out significantly. "delta a" = 5
This patch "delta a" as in the corners of the antenna patch rounded out significantly. "delta a" = 0
Also, could each of the farfield graphing option be simply be explained to me please?
申明:网友回复良莠不齐,仅供参考。如需专业解答,请学习易迪拓培训专家讲授的CST视频培训教程。
上一篇:CST (2014) simulation problem
下一篇:CST: parameters S 12, S 21 and S 22, do not work.